Written by Lisa Lovette, Director, EHR Optimization iatricSystems

A picture really is worth a thousand words. Taking complex ideas or data and compiling them in a single picture conveys the meaning more effectively than any words. Visual communication is still one of the most effective and powerful forms of communication. When applied in healthcare, it presents a clearer picture, increases patient safety, facilitates communication between providers, prioritizes workflow, and improves patient satisfaction. Over the years, healthcare has used many forms or visual communication including whiteboards, diagrams, paper graphs and flowsheets. People tend to remember what they see more than what they hear or read. Having important patient data in one view allows clinicians to make informed choices and decisions, identify risks at a glance, and trend data in real time.
We often see these as patient trackers and dashboards. The frustration comes when we can’t get the information from disparate sources or modules co-mingled on one tracker to show the complete picture you want to convey.
In order to solve the challenge of disparate information, many clinicians are turning to tools that are able to take information from multiple sources and turn it into a full picture. Clinicians are able to be notified of patient risk, monitor disease management, identify changes in patient status, provide interdisciplinary rounding, track bed management and monitoring CMS compliance.
What can be overwhelming is knowing what data you can best track and manage. In order to make these decisions, we recommend you follow these steps:
These tools should be customizable to pull the data you need. They should contain color coding, icons, fonts, informational hovers, alerting and notifications.
One example of how we’ve been helping clinicians communicate with a full picture is with smart boards, to present data in a simple, easy, user friendly meaningful display. The real time views can be used for care team rounding, reporting, charge nurse workflow, and staff hand-off, in one place instead of the data existing in multiple places. Effectively identifying your important patient information and organizing it in a picture or view will increase staff satisfaction and patient safety.
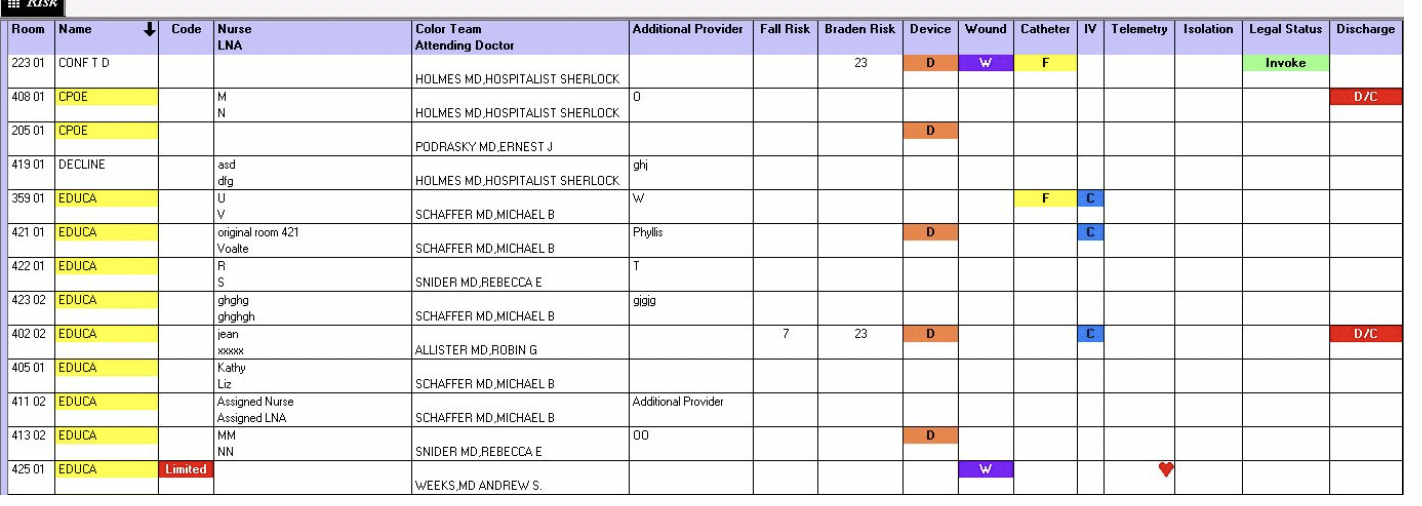
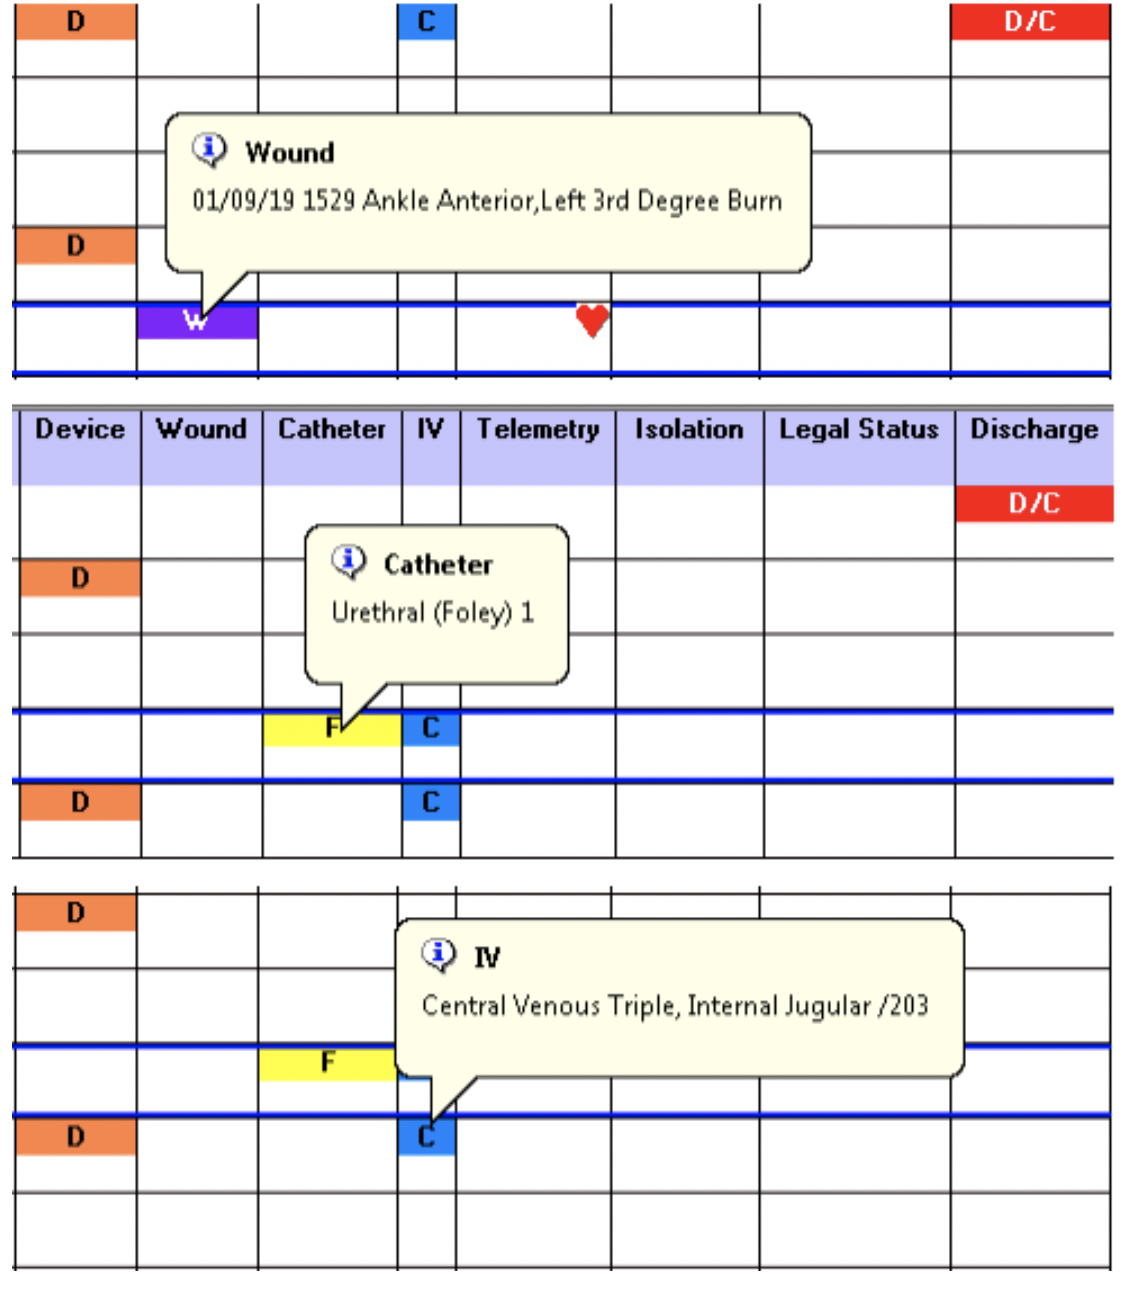
Below is an example of this type of board: it continually monitors 18 pieces of information about this patient. You can quickly see the patient information, status and their associated risk factors. On hover, you'll see information that allow you to drill down and expand on the data. Having to find this amount of data throughout a patient's record would take significantly longer.
Want to learn how other hospitals are creating pictures that paint the story of their patients? Check out this story about Saratoga Hospital where they reduced their readmission rate and provided their caregivers a real time view of critical information at a glance, in order to provide quality patient care and streamline their workflow.
